Monitoring Fish Tanks using Soracom Funnel and Amazon Kinesis
Whether it’s because of an innate curiosity for the natural world or their calming effect on observers, aquariums are one of the more popular fixtures in modern homes. Caring for colorful fish in a well-lit tank can be a peaceful pastime, but it can also require a lot of attention.
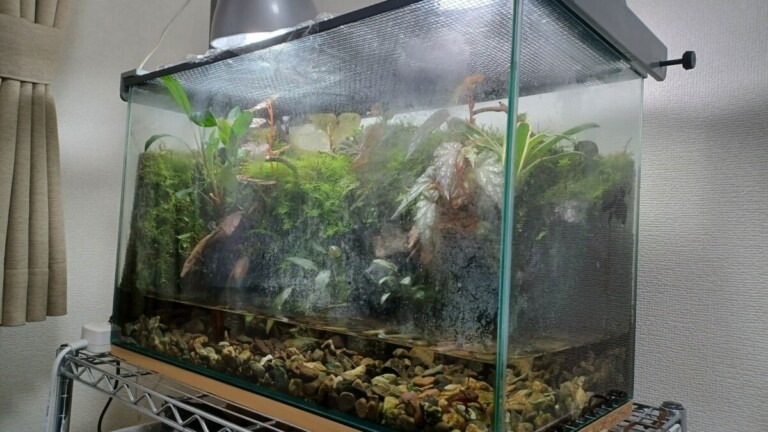
One person who is all too familiar with the amount of time and care it takes to manage an aquarium is Soracom Customer Reliability Engineer, Yusuke Mine, also known as ‘Mike.’ As a hobbyist, Mike knows that maintaining water temperature and humidity levels in the tank can be a little tricky.
Mike uses space heaters to help regulate these factors for his home aquarium, though the system is far from foolproof. Whether a heater malfunctions, user error leads to incorrect settings or a shift in the ambient temperature in the room itself, there are a number of factors that could lead to problems with the temperature and humidity of the tank.
As there are few products on the market designed specifically to monitor the temperature and humidity of an aquarium while also remotely controlling heaters to help regulate those readings, Mike has instead opted for an IoT solution.
In this article, we will look at how Mike used Soracom services to collect and monitor aquarium data in Amason Web Services (AWS). To do so, he created his own unique architecture that can detect water temperature anomalies in an aquarium in real time.

The Setup
For this project, Mike utilized Soracom Arc and Funnel to securely connect the testing network to the AWS cloud. Once there, he deployed Amazon Kinesis Data analytics to detect anomalies to a number of effects.
Let’s break down each step of this configuration.
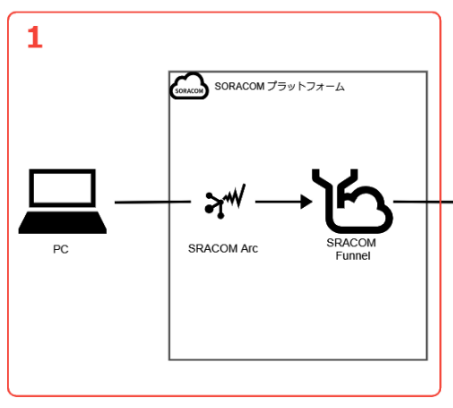
1. Collecting Temperature Data
For the process of collecting the temperature data, Mike utilized his personal PC as a makeshift temperature sensor during the testing phase. This made it easier to create normal and abnormal values for the data than it may have been when using an actual temperature sensor.
For communications, Mike opted to use Soracom’s Arc service, which allows users to access the Soracom platform over various IoT connectivity types (including WiFi, which was used for this build). It gives users access to platform services like Soracom Funnel through a secure virtual private network called WireGuard.
Funnel, a cloud adapter service, was used to send the collected data to Amazon Kinesis Data Analytics. It’s important to note that Data from IoT devices can be transferred to Soracom Funnel-supported cloud services without any additional software development.
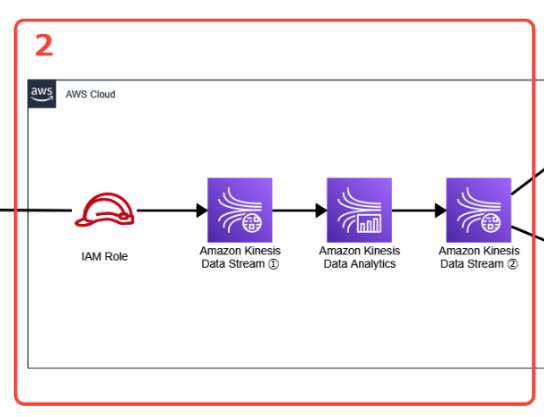
2. Using Amazon Kinesis to Detect Anomalies
Data collected from the PC in step 1 passes through Soracom funnel and into Amazon Kinesis Data Streams (hereafter referred to as Streams), which perform data reception conversion and flow control – allowing Kinesis Data Analytics (heareafter referred to as Analytics) to analyze the data itself. This makes each function general-purpose, which has the advantage of making it easier to combine with other services (pipeline construction).
While being processed by Analytics, we receive the temperature data and calculate the degree of anomaly (based on outlier score) with a well-known machine learning algorithm called ‘Random_Cut_Forest,’ which detects anomalous data points. The same thing could be accomplished by setting fixed rules, such as “if temperature exceeds X,” but this ignores a lot of context. Water that gradually reaches a temperature of 77 degrees as the day goes on, for example, may not require the same response as water that suddenly spikes at that temperature due to a heater failure. When properly applied, the algorithm could help distinguish between normal and abnormal events.
Analytics will establish an anomaly score based on baseline data and can create a response to inform the decision-making process. “When I tested it several times this time, it seemed that if the outlier score was 1.5 or higher, it could be judged as abnormal,” writes Mike. “I think that everyone will actually compare the test data and the outlier score to make a judgment around this point.”
Other AWS services that can detect anomalies include:
Amazon SageMaker, a machine learning platform, and Amazon CloudWatch, a log monitoring service. This time, we used Amazon Kinesis Data Analytics, which makes it easy to build an IoT data pipeline.

3. Storing Data in Amazon S3
Once thoroughly analyzed, the data is run back through Streams before it is stored in Amazon S3 via Amazon Kinesis Data Firehose and used for integration with messaging software Slack via AWS Lambda. All results will be recorded and stored, regardless of their anomaly score, and these results can then be used to identify future outlier scores.
Results can even be used as time-series data even after operation, which is part of the reason Amazon S3 was built into this architecture.

4. Using Slack for Anomaly Notifications
In this build, when anomalies are recognized (i.e., exceed the established outlier score), notifications are sent to Slack via AWS Lambda. The idea was to create a near-real-time notification structure for the aquarium – yet after several tests, Mike was still finding room for improvement.
The first issue was that too many events were being labeled as an anomaly, leading to a number of unnecessary notifications and questionable data points. The second, larger issue was that there was no recovery report when the system detects a return to normal baseline conditions.
Fortunately, both of these issues can be solved by state management. Specifically, once an abnormal condition is detected, the system will not notify the user of the next and subsequent abnormal events and can also notify the user when normal conditions have returned.
Points of the Actual Construction
Now let’s look at the actual anomaly detection using Amazon Kinesis Data Analytics.
There are two types of Analytics, as shown below, but this time we will use Amazon Kinesis Data Analytics for SQL, which allows the use of the RANDOM_CUT_FOREST function.
| Amazon Kinesis Data Analytics for Apache Flink and Studio | A service that allows you to create processing and analytics based on Apache Flink in a development environment that allows you to interactively query stream data in real time. |
| Amazon Kinesis Data Analytics for SQL | A service that allows you to create processing and analysis using SQL. |
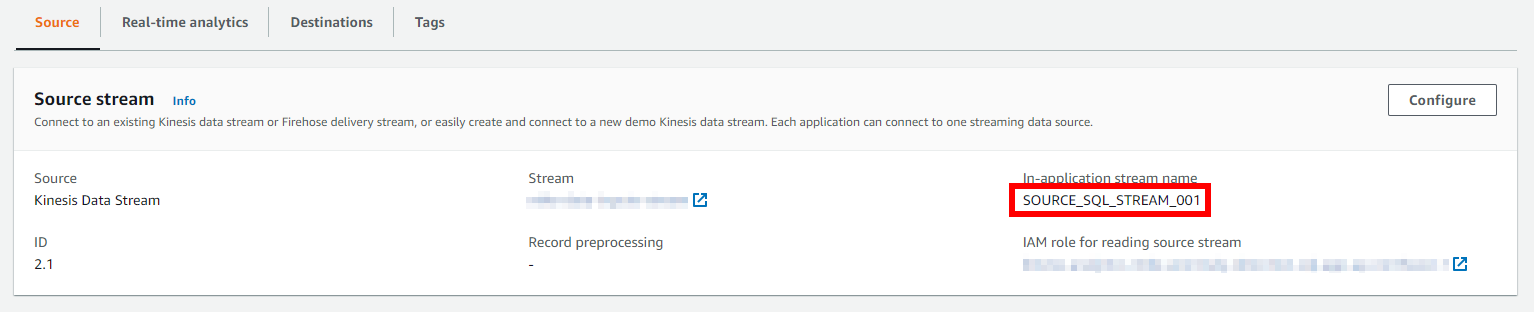
The first step in Analytics is to specify the sources (inputs) to be processed and the destination (outputs) of the processed data. Set the name of each in your application as shown below, and describe the SQL statement. In this instance, the destination is a single Amazon Kinesis Data Streams, but multiple destinations can be set.s.

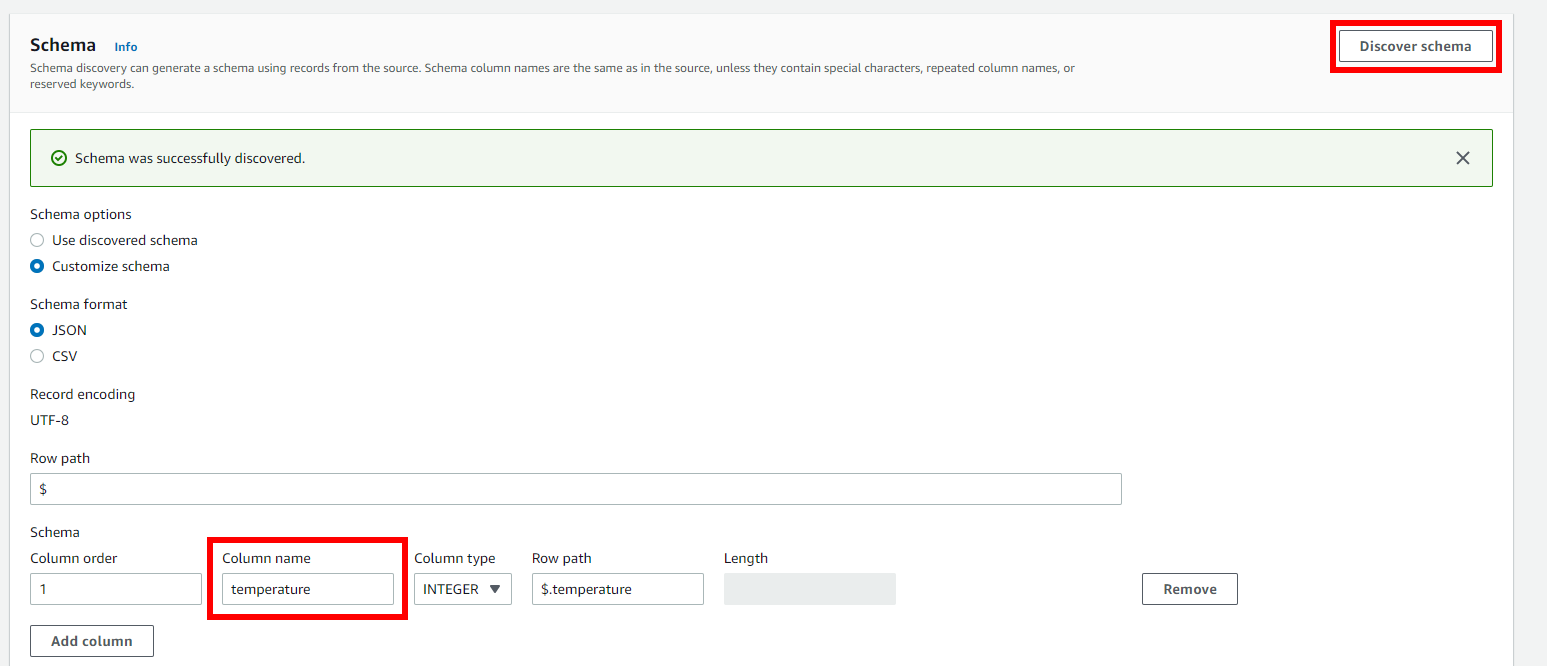
Incidentally, if you send data to the source Amazon Kinesis Data Stream, the schema of the source can be detected automatically. In this case, we will only use the `temperature` schema for the sample data to be streamed later.
Here is where we will use the Random_Cut_Forest (RCF) function. When using this function, you also specify the hyperparameters needed for training. Default values are available, but it is preferable to set them according to the application. In this case, Mike used the following values for quick results in the validation.
| numberOfTrees | 100 |
| subSampleSize | 64 |
| timeDecay | 100 |
| shingleSize | 1 |
For more information on the RANDOM_CUT_FOREST function and the meaning of its parameters, please refer to the AWS documentation and references below.
- Example: Detecting Data Anomalies in a Stream (RANDOM_CUT_FOREST Function) – Amazon Kinesis Data Analytics for SQL Applications Developer Guide
- RANDOM_CUT_FOREST – Amazon Kinesis Data Analytics
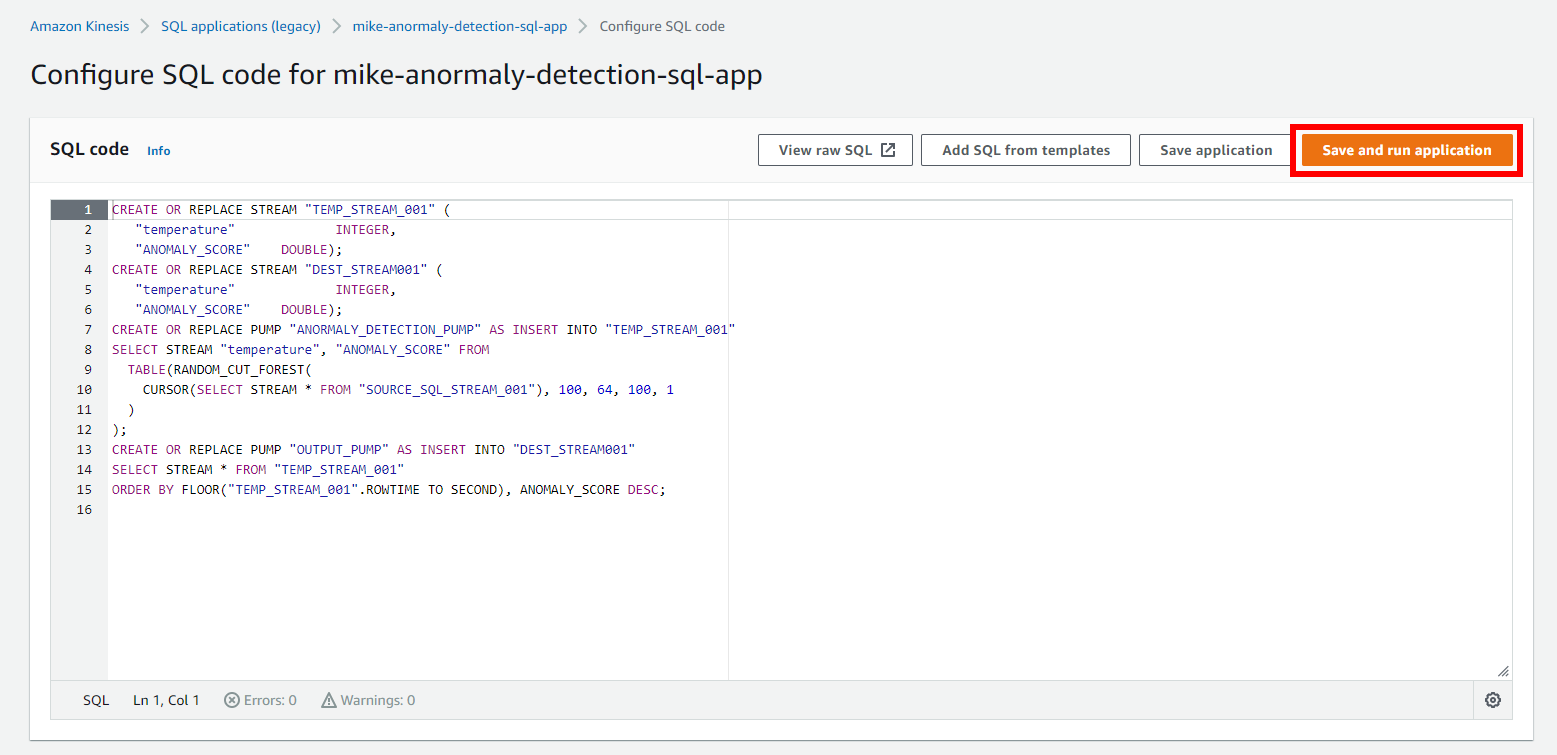
This SQL statement is based on the above sample. It calculates an anomaly score for temperature.
CREATE OR REPLACE STREAM "TEMP_STREAM_001" (
   "temperature"             INTEGER,
   "ANOMALY_SCORE"    DOUBLE);
CREATE OR REPLACE STREAM "DEST_STREAM001" (
   "temperature"             INTEGER,
   "ANOMALY_SCORE"    DOUBLE);
CREATE OR REPLACE PUMP "ANORMALY_DETECTION_PUMP" AS INSERT INTO "TEMP_STREAM_001"
SELECT STREAM "temperature", "ANOMALY_SCORE"
  TABLE(RANDOM_CUT_FOREST(
    CURSOR(SELECT STREAM * FROM "SOURCE_SQL_STREAM_001"), 100, 64, 100, 1
  )
);
CREATE OR REPLACE PUMP "OUTPUT_PUMP" AS INSERT INTO "DEST_STREAM001"
SELECT STREAM * FROM "TEMP_STREAM_001"
ORDER BY FLOOR("TEMP_STREAM_001".ROWTIME TO SECOND), ANOMALY_SCORE DESC;
The results of the analysis will be delivered to the destination when you “Save and Run” the application.
The Results
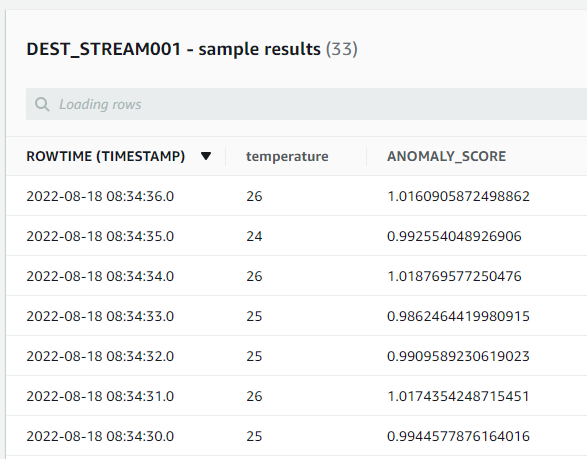
Let’s send the sample data to SORACOM Funnel several times, assuming that the water temperature is measured between 24 and 26 degrees Celsius.
{ "temperature" : 24 }
{ "temperature" : 25 }
{ "temperature" : 24 }
{ "temperature" : 26 }
After sending the above data to SORACOM Funnel, you can preview the sample results on the Analytics side. The first few abnormal events will be output as 0. This is because there is no training data for comparison. In this setup, scores are calculated when the number of records exceeds 100. The screen below shows that the abnormal score is calculated at around 1 ± 0.15.
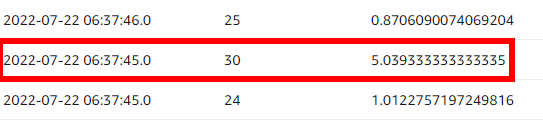
Should there be a sudden spike in that water temperature, whether it be from a heater failure or inflow of outside air, data at 30°C is run.
{"temperature":30}This will record a high abnormal score. In this build, Lamba will then notify the user that parameters have been tripped, causing a notification to be sent to Slack.

How Can I Configure All of the Other Services?
In this blog, we focused primarily on Amazon Kinesis Data Analytics, yet that’s only a part of this project. Here are some links on how to configure the other services introduced in this architecture.
- About Soracom Arc
- About Soracom Funnel
- About Amazon Kinesis Data Streams
- About AWS Lambda
- About Amazon Kinesis Data Firehose
- About Slack incoming webhooks
In Summary
In this project, we were able to send data from Soracom Funnel and detect temperature anomalies in our aquarium using Amazon Kinesis Data Analytics.
In the test, we used a PC and SORACOM Arc to send pseudo-sensor data, but this could easily be replaced with a single-board computer like a Raspberry Pi. In the future, we would like to consider hyper-parameters that match the frequency of data collection from actual sensors and further polish the configuration of the notification element by using AWS IoT Core Device shadow and some kind of dashboard in order to promote the IoTization of aquariums.
………………
Got a question for Soracom? Whether you’re an existing customer, interested in learning more about our product and services, or want to learn about our Partner program – we’d love to hear from you!