Setting Up Real-Time Analysis with Amazon Kinesis and Soracom

Real-time analysis is fast becoming essential to modern business – and with the growth of AI and machine learning tools like ChatGPT, more organizations are looking to utilize these tools to gain better and more actionable business insights. To that end, we will use this blog to introduce a simple real-time analysis solution using Amazon Kinesis and Soracom.
Our Japanese team has previously covered this topic in this blog, though that version can be a little long-winded and too specific. This time around, we thought it best to outline the whole code to simplify the process. You will want to verify hands-on afterward, but all the same – Let’s see how to set up real-time analysis using Amazon Kinesis and Soracom!
Architecture
First, let’s look at the architecture of this project.
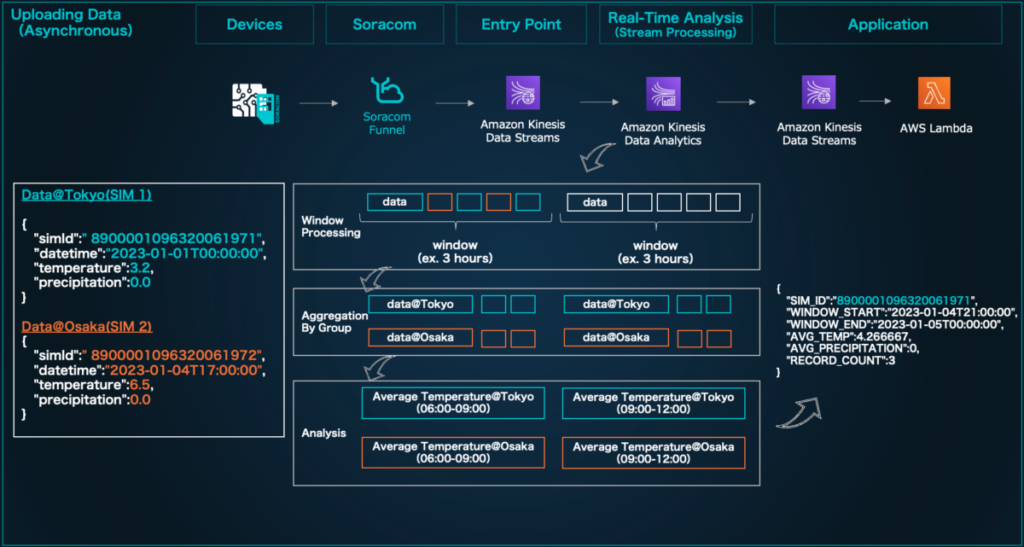
For this example, we are looking at an IoT project that tracks weather data, with one device deployed in separate cities several hours apart from each other (in this instance, Tokyo and Osaka). This device periodically measures the ambient temperature, sends location information, and uses that data to help predict future weather patterns.
In the architecture, the data flows as follows:
- Data Upload
- Model Construction
- Device Control
In the Data Upload stage, the SIM ID, time, and temperature readings are periodically sent from the device, and a mechanism is built to calculate the average temperature every 3 hours in each region (in real time) using Amazon Kinesis Data Analytics. The data from each region is aggregated separately based on location before it is processed together by SIM ID. In our example, we also linked the data to AWS Lambda to track the results in a log for verification.
Our example device simulates the operation by running Soracom Arc, though you can also connect the device by simply using a Soracom IoT SIM in your own environment.
Building A Real-Time Analysis System
Now that we’ve established the architecture, let’s build the real-time analysis portion of our project.
Create a Kinesis Data Stream
For this example, we will need to create two Kinesis Data Streams.
- weather-destination: Stream for linking data to Soracom Funnel
- weather-source: Stream for outputting analysis results

Create an IAM Role
Create an IAM role for Soracom Funnel to send data to Kinesis Data Stream.
In IAM Policy, please set the permission to weather-source and create kinesis:PutRecord kinesis:PutRecords.
| { “Version”: “2012-10-17”, “Statement”: [ { “Sid”: “VisualEditor0”, “Effect”: “Allow”, “Action”: [ “kinesis:PutRecord”, “kinesis:PutRecords ] , “Resource”: “arn:aws:kinesis:us-west-2:9039********:stream/weather-source” } ] } |
Next, allow Soracom’s AWS account to use the authority on the IAM role creation screen.
- Japanese coverage:
762707677580 - Global coverage:
950858143650

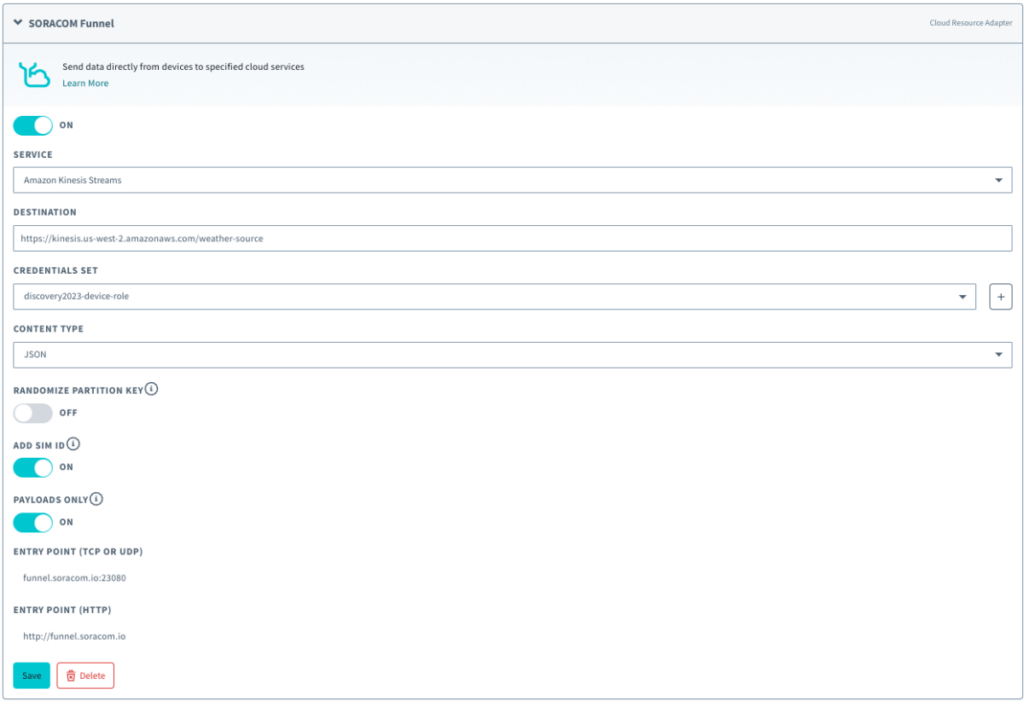
Soracom Funnel Settings
Now we will enable the data to be sent from the device to the Funnel endpoint and configure the settings to link to Kinesis Data Stream.
Registering IAM Roles
When Soracom Funnel uses Kinesis Data Stream, the necessary authorization information must be registered in the Soracom authentication store.
Register the “AWS IAM Role Credentials ” created earlier by referring to the user document ” Registering Credentials.”
Your Soracom Funnel settings should look like this:
Setting up Kinesis Data Analytics
Now let’s set up Kinesis Data Analytics and configure the settings for real-time analysis.
Kinesis Data Analytics is based on an OSS called Apache Flink, which enables distributed processing of large-scale data.
It is possible to create a distributed processing job and build an analysis platform that executes analysis as a resident application, but for this test, we will launch and configure a Notebook instance that allows interactive job operations.
Create Kinesis Data Analytics
First, create a notebook from the Kinesis Data Analytics screen.

Notebook Development
Log in to the created Notebook, copy and paste the following code into a cell, then press Ctrl + Enter to execute it.
In the first cell, we write a process that reads data from a Kinesis Data Stream and will name it weather-source.
We are creating a table, but executing this SQL will create a table in the AWS Glue database.
%flink.ssql(type=update)
DROP TABLE IF EXISTS weather_data;
CREATE TABLE weather_data (
simId VARCHAR,
datetime TIMESTAMP(3),
temp FLOAT,
precipitation INTEGER,
WATERMARK FOR datetime AS datetime - INTERVAL '5' SECOND
)
PARTITIONED BY (simId)
WITH (
'connector' = 'kinesis',
'stream' = 'weather-source',
'aws.region' = 'us-west-2',
'scan.stream.initpos' = 'LATEST',
'format' = 'json',
'json.timestamp-format.standard' = 'ISO-8601'
);Code language: PHP (php)Next, copy and paste the code below into a new cell and run it the same way.
After this, a table will be created that can store the results of statistical processing by Window processing.
By specifying connector = kinesis, stream = weather-destination, the result will be linked to the weather-destination Data Steam created earlier. Checking the log in AWS Lambda should help confirm as much!
%flink.ssql(type=update)
DROP TABLE IF EXISTS weather_data_output;

CREATE TABLE weather_data_output (
    SIM_ID VARCHAR,
    WINDOW_START TIMESTAMP(3),
    WINDOW_END TIMESTAMP(3),
AVG_TEMP FLOAT,
AVG_PRECIPITATION FLOAT,
RECORD_COUNT BIGINT
)
WITH (
    'connector' = 'kinesis',
    'stream' = 'weather-destination',
    'aws.region' = 'us-west-2',
    'scan.stream.initpos' = 'LATEST',
    'format' = 'json',
    'json.timestamp-format.standard' = 'ISO-8601'
);Code language: JavaScript (javascript)
We will now copy and paste the code below into a new cell and run it the same way as in the previous step.
%flink.ssql(type=update)

INSERT INTO weather_data_output
SELECT
simId as SIM_ID,
TUMBLE_START(datetime, INTERVAL '3' HOUR) as WINDOW_START,
TUMBLE_END(datetime, INTERVAL '3' HOUR) as WINDOW_END,
AVG(temp) as AVG_TEMP,
AVG(precipitation) as AVG_PRECIPITATION,
COUNT(*) as RECORD_COUNT
FROM
weather_data
GROUP BY
simId,
TUMBLE(datetime, INTERVAL '3' HOUR);Code language: JavaScript (javascript)
Window processing will be performed every 3 hours based on the timestamp in this setup.
Create an AWS Lambda
Finally, we will create an AWS Lambda that outputs the results of the real-time analysis.
Please specify the Kinesis Data Steam weather-destination created in this AWS Lambda trigger.

As shown, the trigger is set to log the analysis result for verification purposes.

Operation Confirmation
Now that we’re all set up, let’s send some data from the device!
For this project, we utilized past data from the Japan Meteorological Agency website, and will use that to power our tests.
From the device (PC), launch JupyterNotebook and send data to Soracom Funnel.

Once it has been sent, we should be able to confirm that statistical information (i.e., the average temperature for every 3 hours of the testing period) was output to the Cloud Watch log of AWS Lambda.
If you’ve followed our steps, your real-time processing setup should be ready!

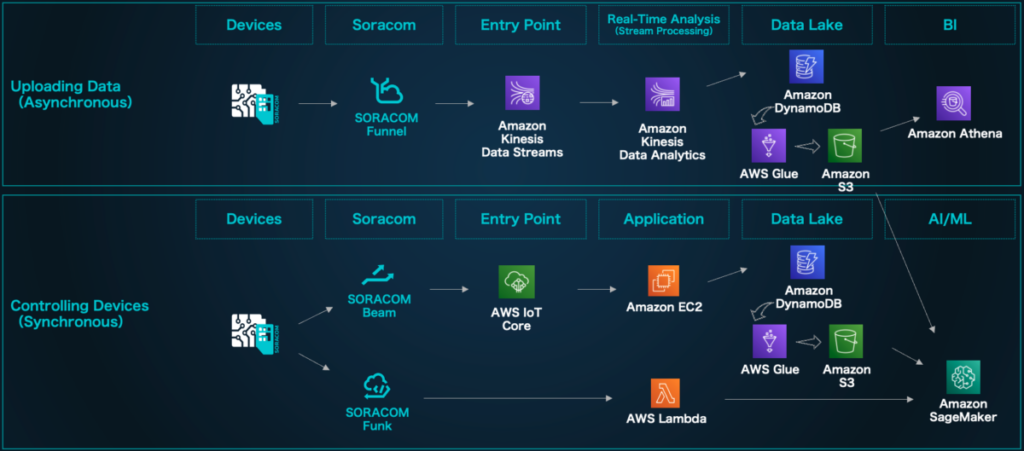
Architecture Example: AI/Machine Learning and Device Control
In this project, we have focused on Amazon Kinesis Data Analytics in our verification architecture, but in a production system, processing such as data upload, machine learning, and device control will be required throughout the IoT project.
Let’s look at an example of the architecture in practice.
1. Data Upload: Stream processing for real-time analysis and data aggregation. Using the Amazon Kinesis Data Analytics introduced in this blog, you can accumulate efficiently processed statistical information in the data lake.
2. Machine Learning: Machine learning model building. Based on the data stored in Amazon S3, we can build an AI/machine learning model using Amazon SageMaker. It is also possible to create endpoints for inferring models created with Amazon SageMaker. Learn more about these possibilities here.
3. Device Control: This is a mechanism that controls devices by connecting them to the cloud. In the architecture example below, we have built a mechanism that allows communication from both the cloud and devices by connecting to IoT Core via Soracom Beam with MQTT communication. Learn more about this connection method here.
As in the sequence at the bottom from devices to Amazon SageMaker through Soracom Funk and AWS Lambda, the devices can predict with models built with Amazon SageMaker. In this example, it is also possible to use gathered data to predict the average temperature at a specific time.
Please refer to ” User Document: Execute AWS Lambda and notify Slack ” for how to call AWS Lambda with Soracom Funk. With the function released in 2023, there is also a method to call Amazon SageMaker via Soracom Beam.
In Conclusion
In this project, we were able to perform advanced Window and statistical processing, which grouped and processed the analysis at specific times in real time. Although many methods can be used to store and analyze data in a database without real-time analysis, the approach introduced here is better when dealing with large-scale data more efficiently.
Please refer to it and try to work on analysis, AI, and machine learning!
This blog was translated from this original piece from our engineer Taketo Matsunaga
………………
Got any questions about an IoT deployment? Soracom offers a number of powerful solutions that have made us a visionary in the IoT space. Chat with us today to learn how a partnership with Soracom can get your project up and running easily and securely. Contact us today!