
Visualize Data for GPS-Enabled IoT Devices with Soracom Lagoon

Today’s developers are looking for a partner to help them securely connect their IoT devices and shorten the time it takes to get their application to market. From our experience, we can say that it’s extremely important for a developer to evaluate their entire system architecture so that their cloud infrastructure and IoT devices work together seamlessly. Using Soracom Air connectivity with real-time data collection and visualization tools like Harvest and Lagoon provides a simpler way to visualize IoT data.
DESCRIPTION
Many of our partners and customers often ask “how do I implement a low-cost application for a GPS-enabled IoT sensor without having to deploy an expensive subscription solution?” This is why the main goal of this blog is to show how easy it is to display IoT data for testing or full-scale production deployments.
We will cover how to visualize data from a GPS-enabled sensor that is able to track temperature, humidity, and device battery levels by creating a visualization dashboard. Best of all, you can implement this entire solution using Soracom services.
PROCEDURE
First, you will need to sign up for a Soracom operator account to be able to create a dashboard in Lagoon. See our Quick Start Guide if you need help setting it up. For this blog, I will be using some sample data that is included in Lagoon to create the dashboard. After you build this dashboard using the sample data, you will want to capture and visualize your own data using Harvest. For additional detailed information on how to set up custom dashboards with Lagoon please see the Lagoon Developers Guide.
SORACOM LAGOON
Lagoon enables developers to create visual dashboards to display data by embedding specific information panels chosen from a set of widgets depending on your needs. It allows users to choose and place various widgets (i.e. gauges, tables, line charts, and maps) on multiple dashboards.
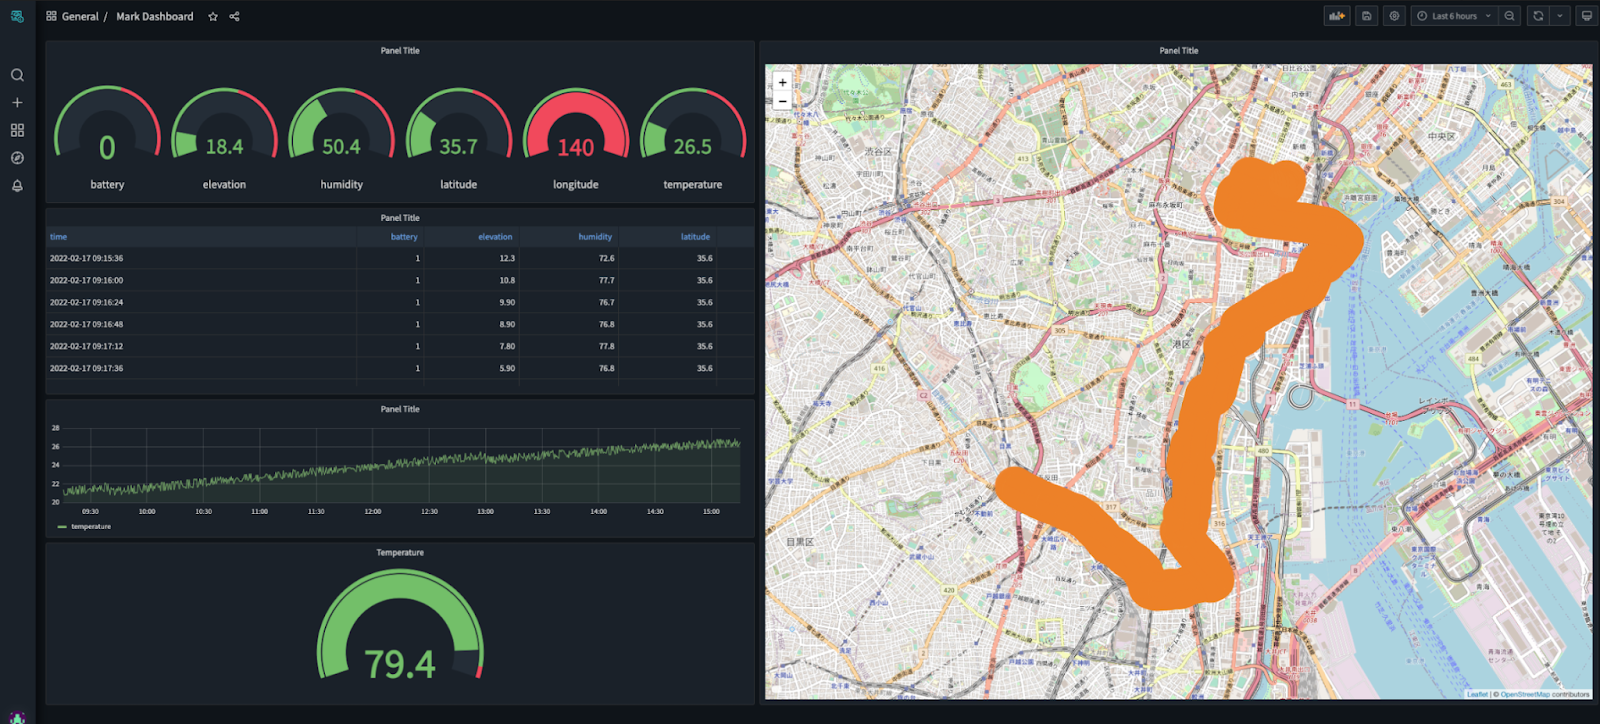
In this section, I will explain how to create each dashboard panel and how to select the specific items you want to display. Below is a sample dashboard we created to track an IoT device’s location, temperature, humidity and battery status with widgets.
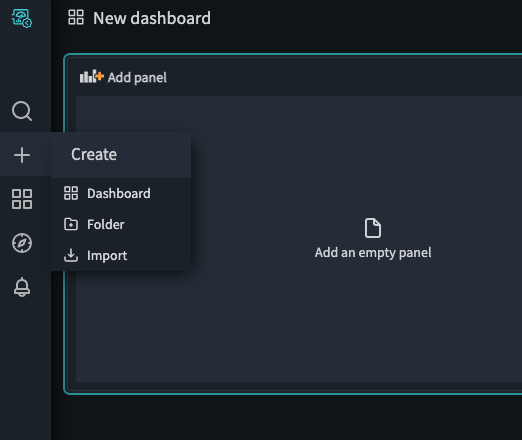
To create a dashboard, start by selecting the +button-> on the left menu.
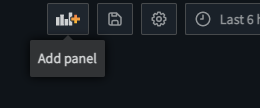
After creating the base panel, to which you can add various widgets to view your data, you will need to click ‘Add panel.’
Then select your data source. I’m using the Demo data source that is built into Lagoon.
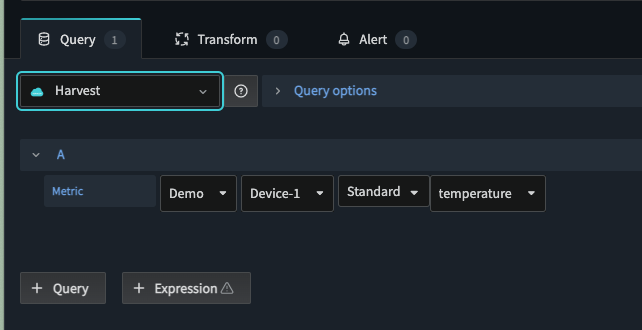
Now we will create a custom dashboard around this data. It contains GPS coordinates, temperature, humidity and battery levels. To select this data, pull down the menu and select Demo, Device-1, Standard and temperature.
It is also recommended to enter a descriptive name for each panel, which can be specified via the ‘Panel title’ option at the top of the panel Settings screen. I will name this panel Temperature since it contains temperature data.
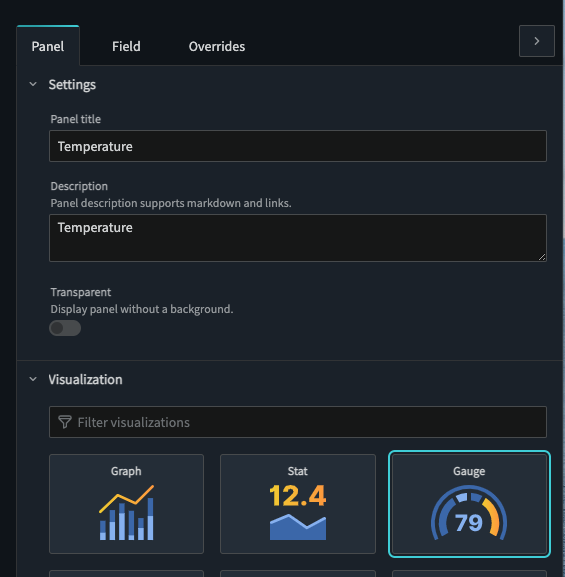
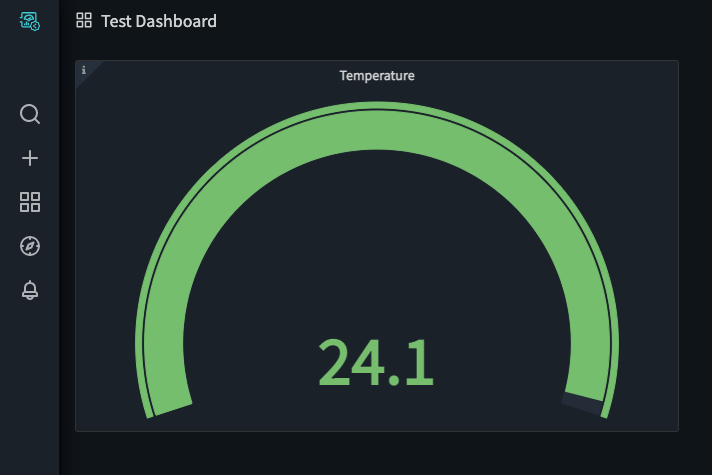
After naming your panel and selecting a Gauge (see above), you will see the following gauge has been created and is displaying the temperature in C.
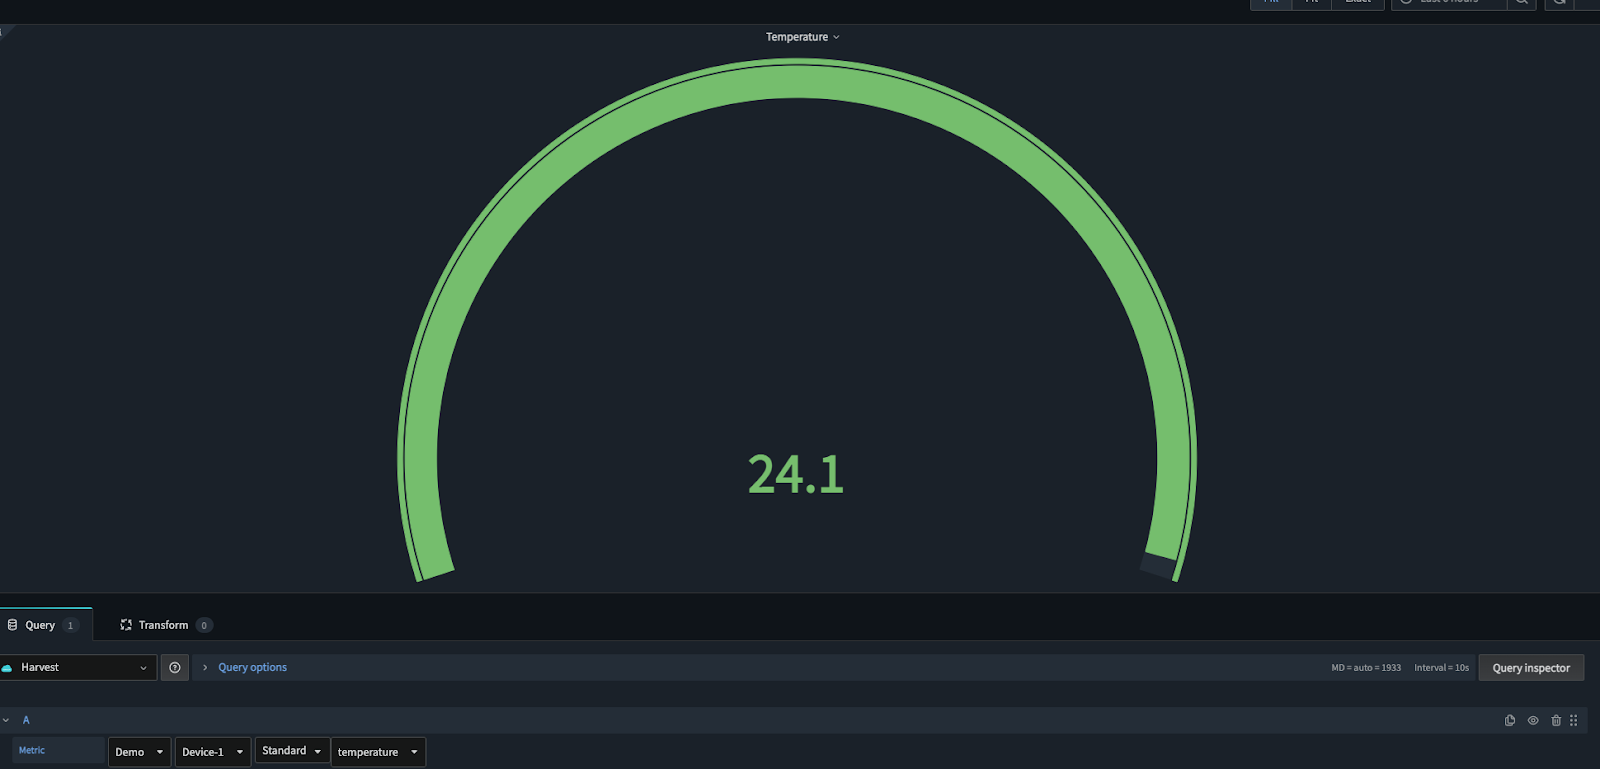
Now that the gauge you just created is displaying temperature, click ‘apply’ to add it to the dashboard page.
This is what you will see when the gauge is successfully added to the dashboard. You have now created a simple dashboard with a temperature gauge.
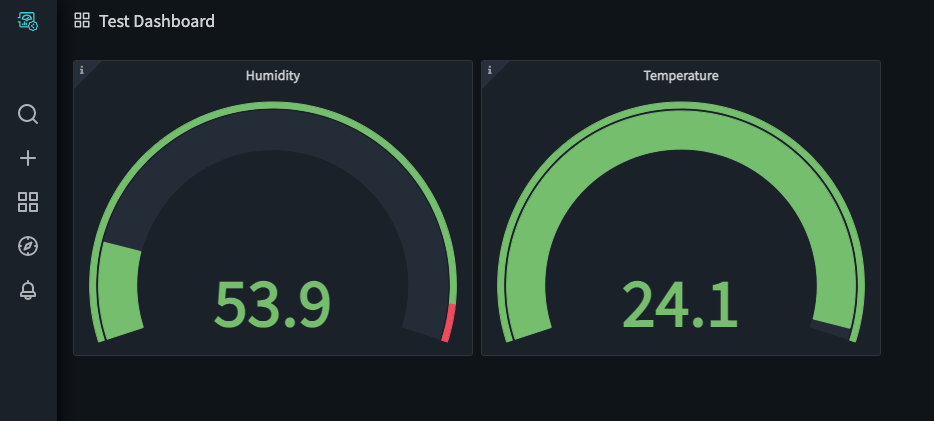
Now, from the main dashboard screen let’s add another panel for displaying humidity. Again, we go back to the ‘add panel’ on the dashboard.
To create a gauge for monitoring humidity, select the humidity data set, then select gauge and click apply, very similar to the steps we outlined above when creating the temperature gauge. This new humidity gauge should now be added to the dashboard.
Using the same process, we will also create a power level gauge and add it to the dashboard.
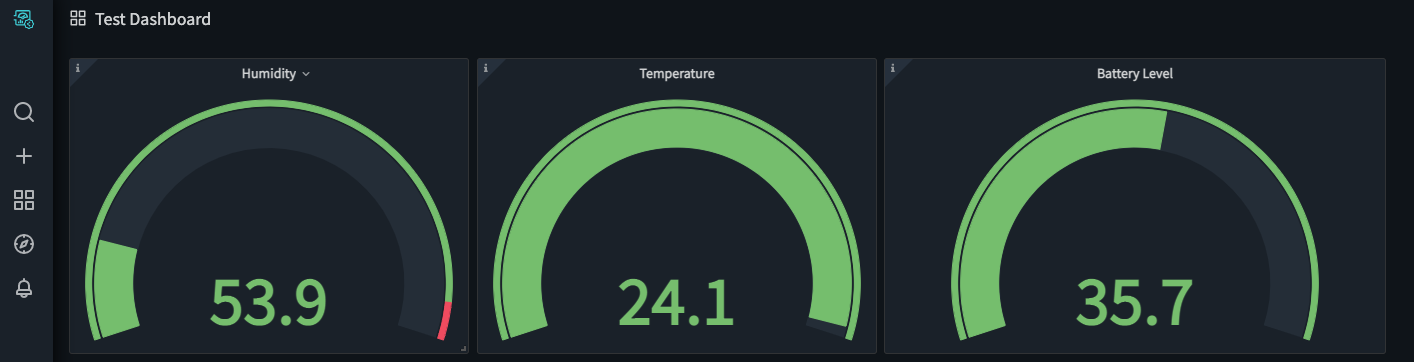
From here, you can drag each gauge where you want it on the dashboard to suit your preferences.
Now let’s create a map tracking the latitude and longitude coordinates that the device has traveled.
From the main dashboard click ‘Add panel.’
Select latitude and longitude data.
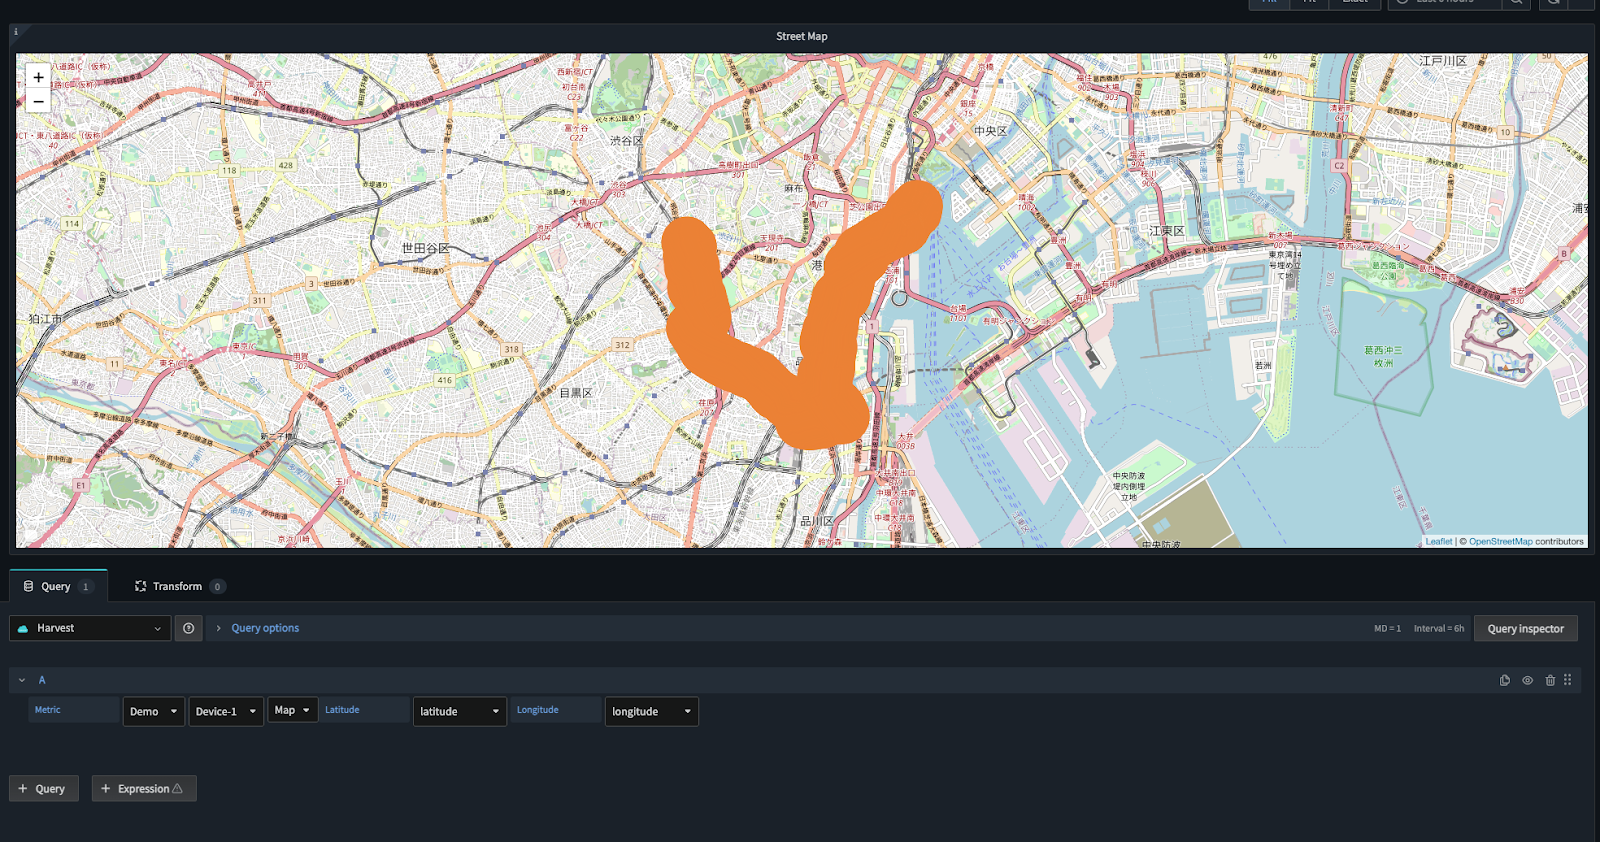
Then name the Panel (I chose “Street Map”) and select Soracom Map Panel.
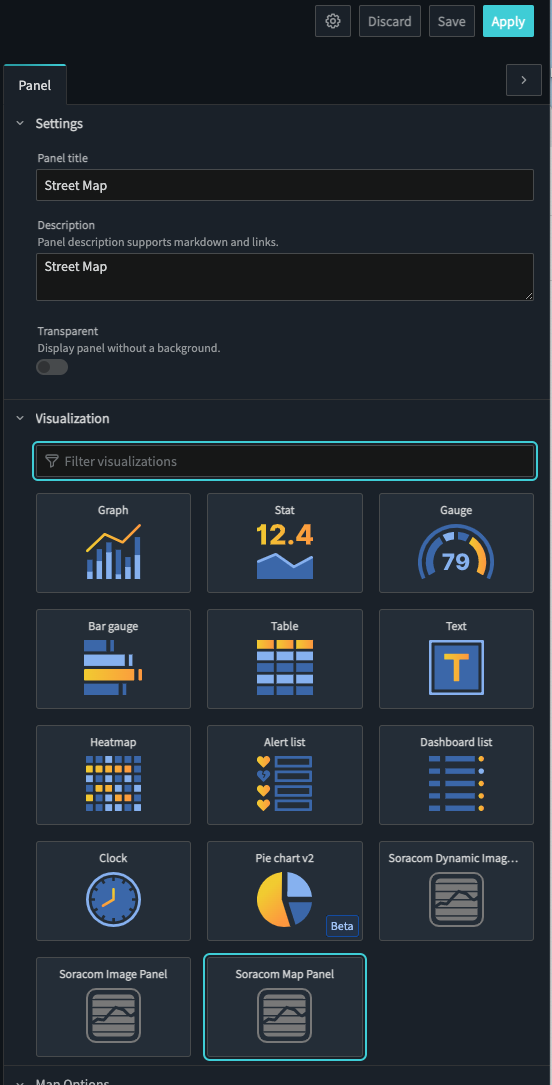
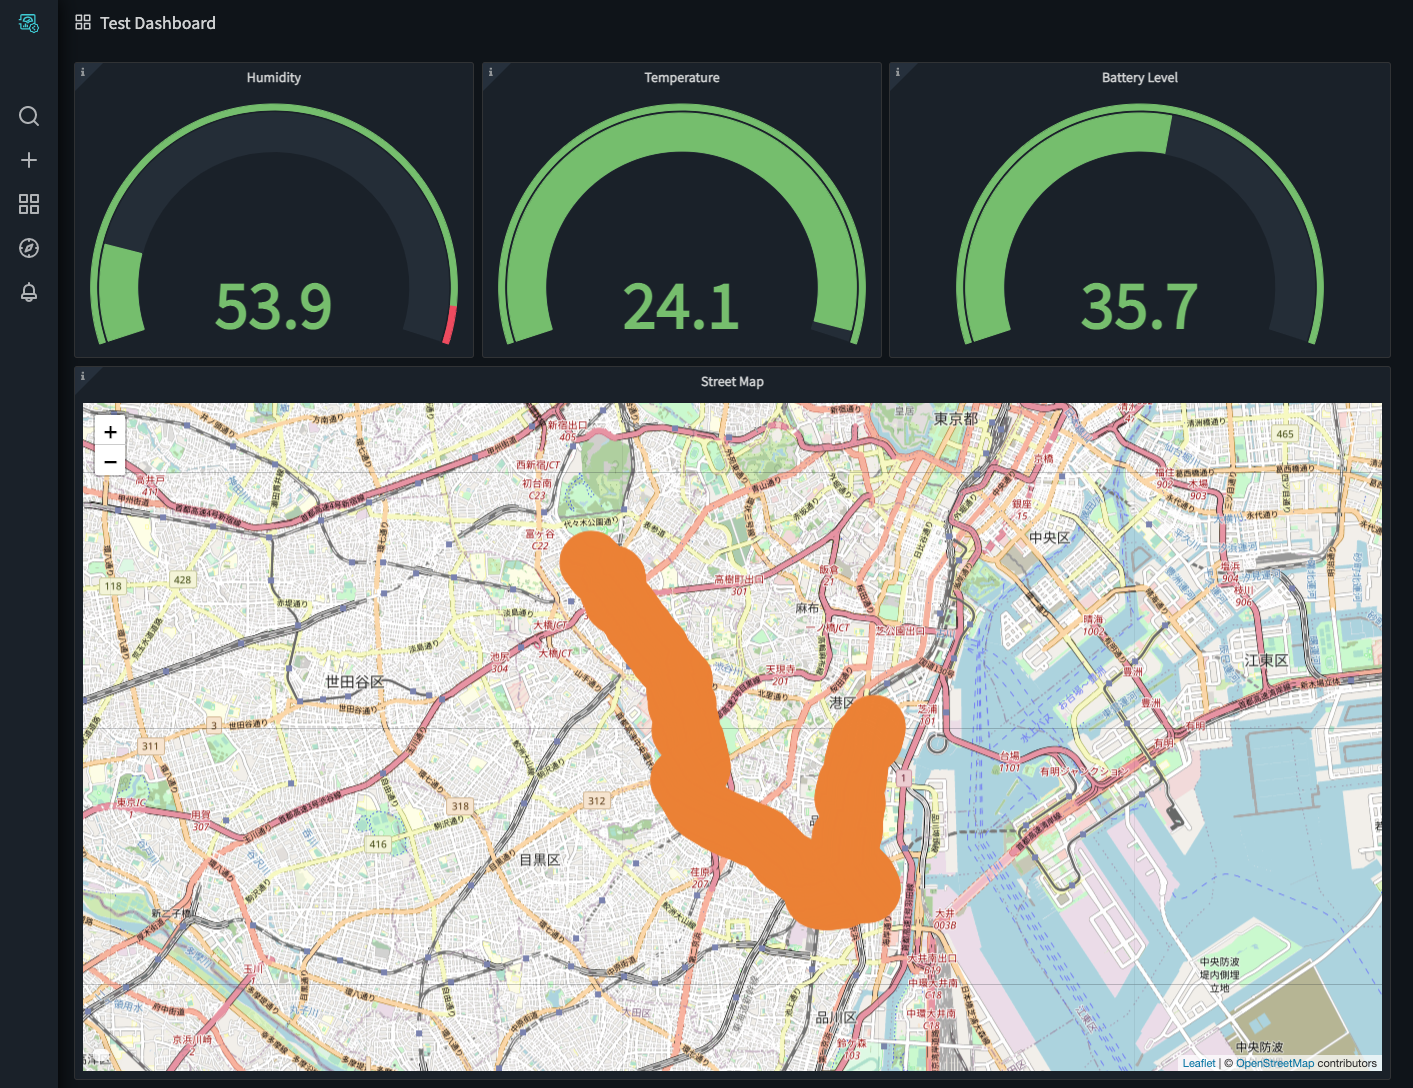
And with that, the following map is created.
When I select ‘apply,’ it will then be entered into the dashboard. We have now created a GPS-enabled IoT sensor dashboard.
CONCLUSION
In this blog, we introduced a simple way to visualize your IoT device’s data in Soracom Lagoon. There are many expensive commercial services that are available on the market, but if you want to quickly create a customized dashboard without having to spin up multiple servers, this serverless method is recommended for ease of use. By using Soracom Harvest to collect and store data, it’s very easy to pull your data into Lagoon for a custom visualization dashboard.
………….
Do you have questions about an IoT project? Speak with one of our experts today to learn how Soracom has helped more than 20,000 innovators deploy, scale, and secure their IoT projects.


MORE LIKE THIS


What is Soracom?
Discover why technology innovators choose Soracom for connecting their
devices to the cloud over cellular.

Soracom's Picks
Advices and interviews, to inform and inspire.


Roaming is Not a Four-Letter Word: Decoding the Complexity of Global IoT Deployments Without the Massive Bill
TL:DR Picture the moment. A VP of Operations is reviewing…

Catch the Traffic Before You Cut It Off: Auto-Capturing a PCAP with Event Handler + Soracom Flux
TL:DR The 10 GB Weekend A field device sits on…

Retail’s “Invisible” Workforce: How IoT-Enabled Vending and Kiosks Are Rewriting the Rules of the Brick-and-Mortar Experience
TL;DR Walk through a modern shopping mall before the anchor…


Cloud Native
IoT Connectivity Platform
Soracom built the worlds first cloud-native connectivity management platform, built on AWS. Learn more about going beyond connectivity.