
Hack your Business Analytics with an IoT Dashboard
Monitor Data in Real Time with An IoT Dashboard!
One thing drives IoT projects more than anything: data. After all, it’s what IoT devices collect regardless of industry and it’s what provides the insights that businesses leverage to grow. However, with thousands of IoT devices sending in packets of data every second, it can be difficult to parse through all of the numbers. In situations like this, having a comprehensive IoT dashboard can make an enormous difference in your ability to decipher the data you’re collecting.
Not only can it provide you with an in-depth under the hood look at your IoT project, but it can also uncover problems that have been holding back performance. This is especially true when different types of information— temperature readings mixed with soil moisture levels and humidity percentages— flooding through the system in real-time.
Here are a few features that make IoT dashboard an easy decision for your IoT project.
Visualization with Variation

If there’s one thing we learned from elementary school, it’s that all graphs aren’t the same. Using a pie graph to show distance and time just doesn’t resonate as well as other choices.
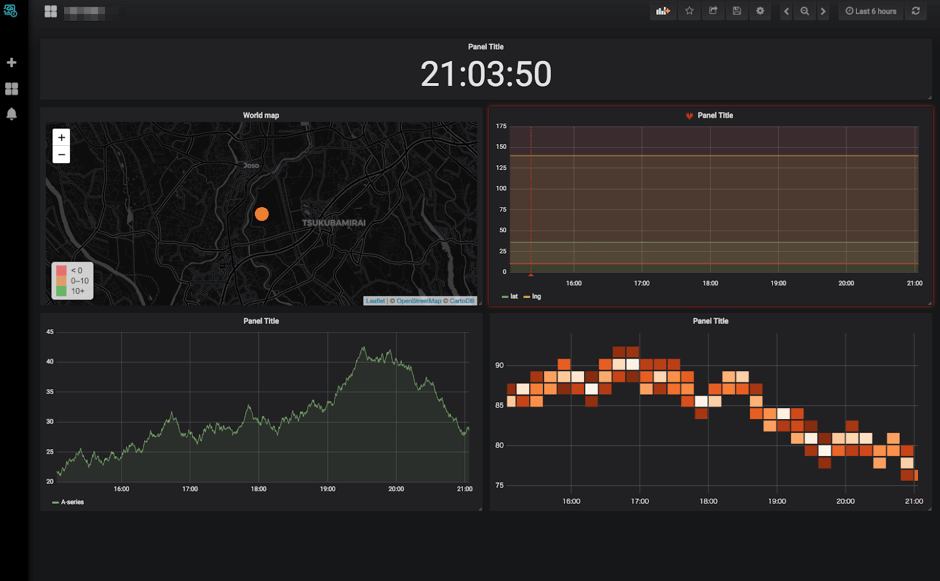
Luckily, most IoT dashboards offer multiple ways to view the data that your devices are collecting. This can allow you to choose the best way to visualize your findings in a way that is quick and easy to understand. Plus, depending on how you showcase your data, it can provide findings that were previously hidden from view, allowing you to continue improving your business model.
Simple Setup

When you have an incredible idea, you want to be able to run with it immediately. However, in some situations, it may take time to setup your infrastructure before your devices can start collecting data. What’s worse, it can take even more time to set up parameters like credentials and time-stamping so that you can fully understand the information that you’re collecting.
IoT dashboards can automatically validate and timestamp the data that comes through in real-time so that your operation isn’t held up. Data visualization is far too important to be an afterthought for when your IoT project is up and running.
Analytics Anywhere

Some IoT developers choose a single IoT management console — whether its a tablet or a desktop — to access all of their information as a way to control risk.
While this may seem valuable in practice, it can also be debilitating for expansive IoT projects that stretch beyond a single city or country.
Having to visit each physical location to access your device data costs time and money that can be better spent creating. With a virtual IoT dashboard, users can access their data from wherever they want, watching in real-time as their devices collect data. This can allow them to validate that their project is operating as it should without having to visit the physical location.
Plus, it enables IoT projects of any budget to access their devices without needing an army of technicians.
Finding the Right Visualization for your Project
Understanding the data you collect is just as important as collecting it. It can influence business decisions, uncover device issues, eliminate unclarity and more. However, while some IoT projects may require a simple time-series graph for their operations, others may benefit more from a comprehensive IoT dashboard that can be fully customized to their needs.
Soracom knows how important visualization is to IoT project managers. After all, we’re developers ourselves. That’s why we built a variety of different ways for our clients to see their data in real time depending on their needs.
Our IoT data visualization service allows users to see your information without any server or storage setup so that IoT projects can get up and running in minutes with their devices.
Plus, our comprehensive IoT dashboard service allows IoT developers to combine multiple graphs — heat maps, tables, lists and more — into one intuitive dashboard platform without needing to set up a dashboard.
Not only do these allow you to discover trends but it can also be a perfect format for you to share your findings with important stakeholders.
What’s more, users can set thresholds for any data that is being collected — whether its temperature levels or GPS latitude/longitude. Once this parameter is passed, an email or text notification can be sent in real time, allowing you to keep a watchful eye on your operations around the clock.
Contact us today and get ready to see your data like never before.


MORE LIKE THIS


What is Soracom?
Discover why technology innovators choose Soracom for connecting their
devices to the cloud over cellular.
Soracom's Picks
Advices and interviews, to inform and inspire.

Why Bluetooth + Cellular is the Secret Sauce for Modern RTLS
How Cellular and Bluetooth is Powering RTLS Growth The world…

Moving Toward Seamless IoT: How SGP.32 Addresses Critical Connectivity Gaps
Why SGP.32 Changes Everything for IoT For years, the promise…

[Podcast] No More Dark Spots: Mastering RTLS and Asset Tracking with Lamplight Logistics
Building in IoT is never a straight line. Welcome back…


Cloud Native
IoT Connectivity Platform
Soracom built the worlds first cloud-native connectivity management platform, built on AWS. Learn more about going beyond connectivity.