What’s New with Soracom Lagoon
Data visualization was one of the most requested features from Soracom customers before we launched the original version of Soracom Lagoon back in 2018.
Since then, Lagoon has gone on to become one of our customers’ best-loved tools, making it easier than ever to create advanced dashboards that visualize IoT usage across a broad fleet of devices in new and innovative ways.
Today, we’re excited to announce a new version of Lagoon. Available to all Sorcom customers, this update includes enhancements to all of Lagoon’s existing functionality, along with the introduction of some brand new data visualization features.
What’s new in Soracom Lagoon?
Soracom Lagoon now includes a broad range of new features that helps technology innovators visualize their IoT data usage more effectively.
- Explore – Easy Data Visualization & Comparison
- Expression – Data Conversion and Custom Calculations
- Inspect – Raw Data Analysis
- Override – Overwrite Display Names
- Playlist – Create Dashboard Slideshows
- Sample Data – Learn How To Use Lagoon
- Transformation – Data Filtering
1/ Explore – Easy Data Visualization & Comparison
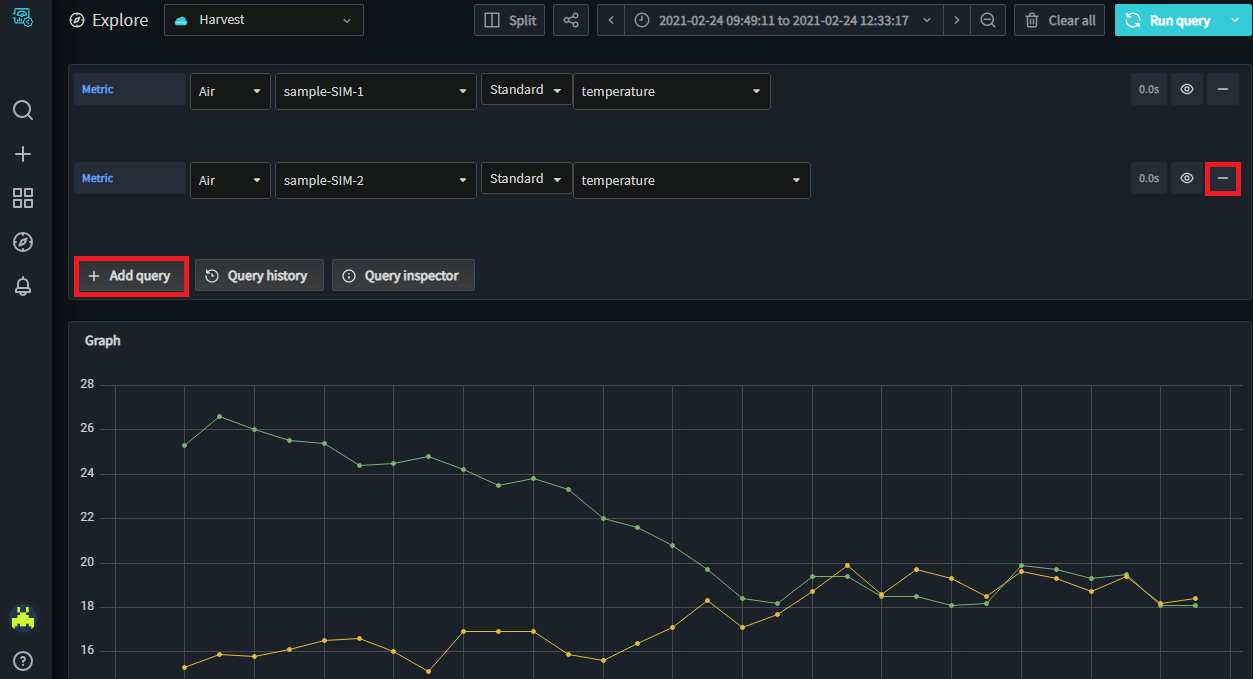
The Explore function allows you to visualize data faster and more easily than before. Display data from multiple SIM cards and devices on the same screen, and compare usage over any given timeframe.
Find out more about Explore in Soracom Lagoon
2/ Expression – Data Conversion and Custom Calculations
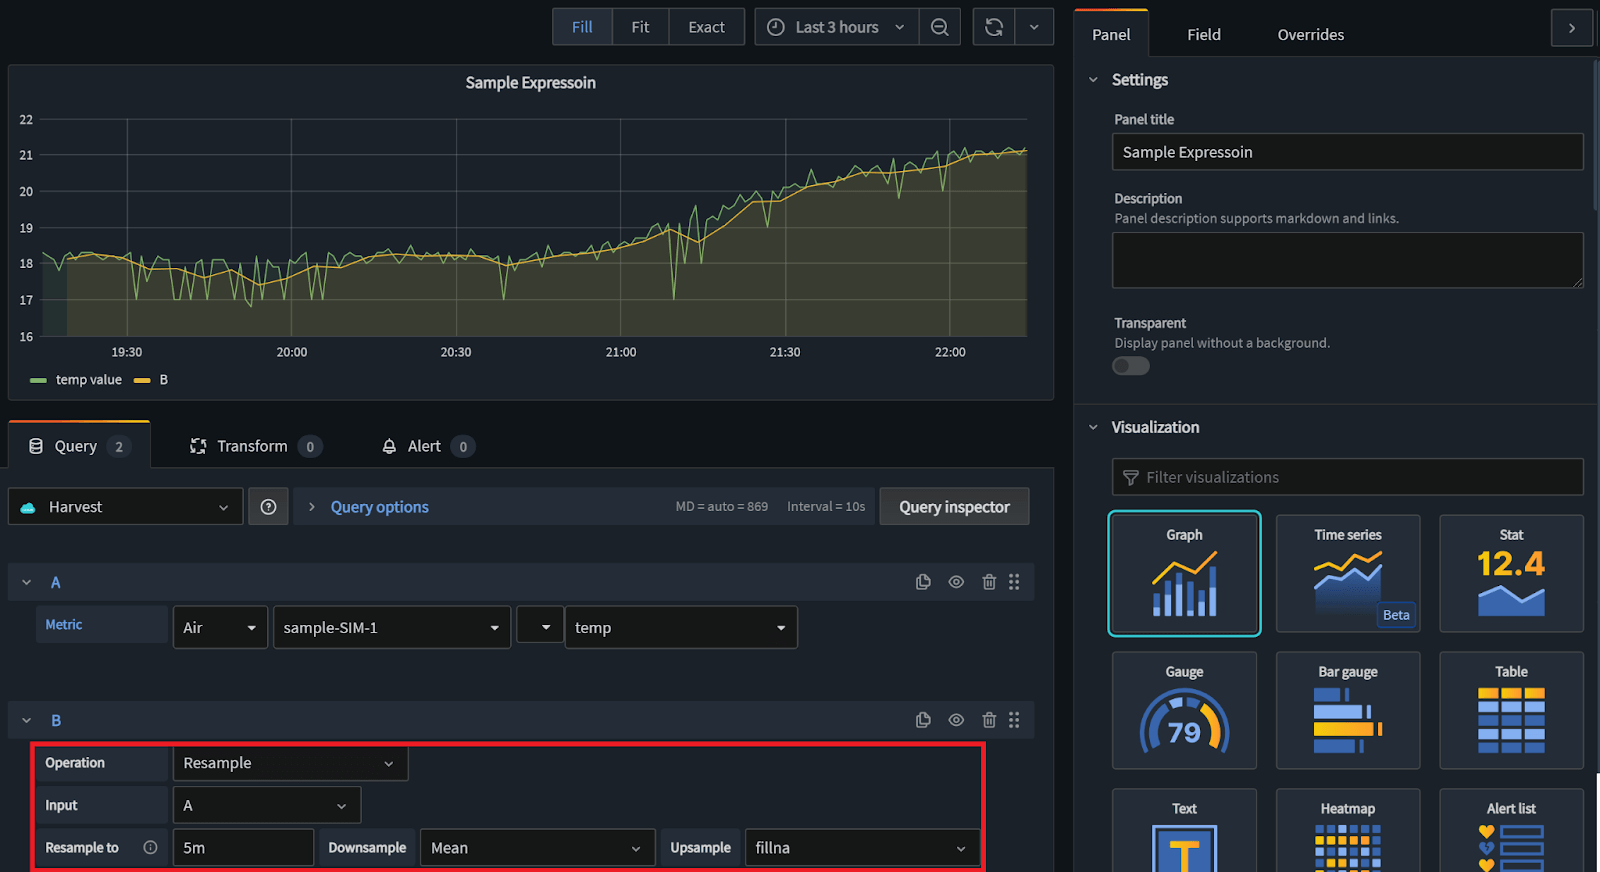
Use the Expression function in Soracom Lagoon to convert data on the fly. For example, if you have a sensor that’s sending temperature data in Fahrenheit and you want to display it in Celsius – the Expression tool gives you the option to enter a simple equation that’ll convert data to the desired metric.
You can also create your own calculations to view data usage over a custom timeframe… for example, taking a temperature reading from your device as an average every 5 minutes.
Find out more about Expression in Soracom Lagoon
3/ Inspect – Raw Data Analysis
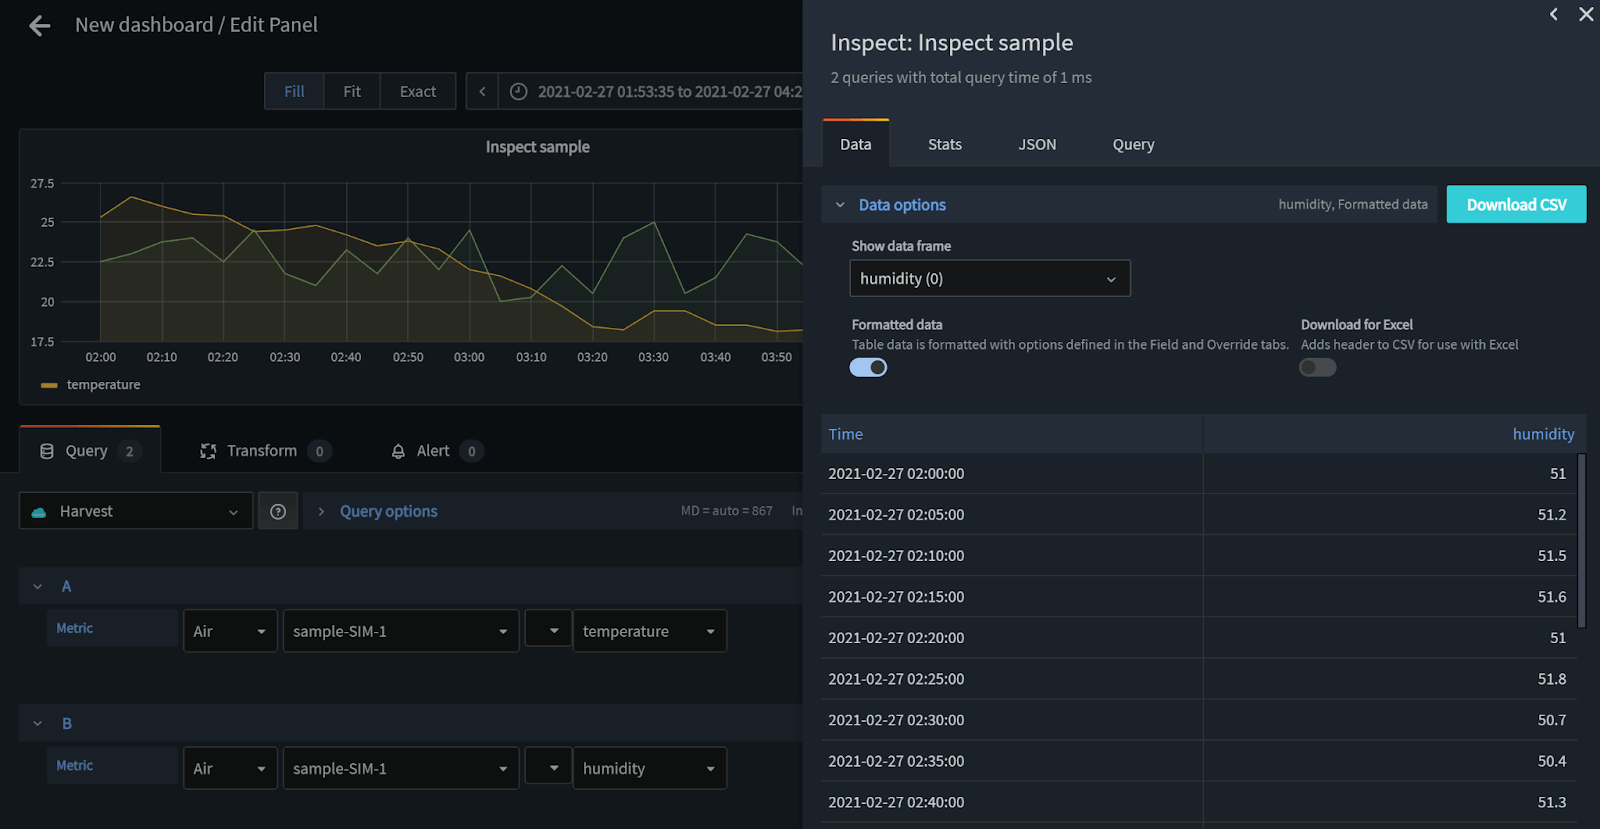
When you need to see the raw data for any graph in Lagoon, you can use the Inspect function to export a CSV file, allowing you to dive deeper into any of your data with Google Sheets or Microsoft Excel.
Find out more about Inspect in Soracom Lagoon
4/ Override – Overwrite Display Names
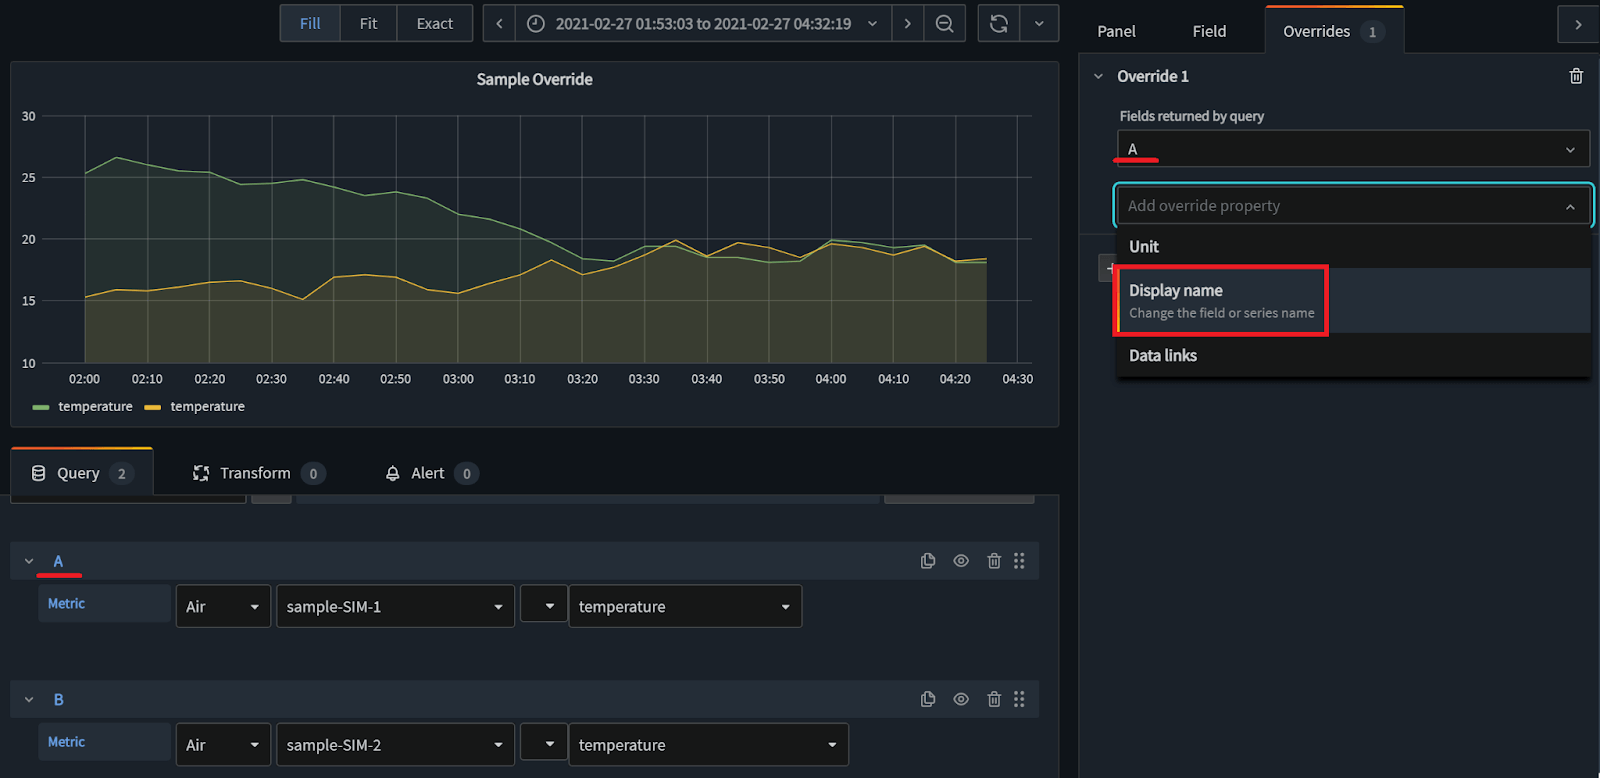
Sometimes the way data is outputted into tables isn’t quite right. With the new Override function you can change the name of any display name across any of your tables quickly and easily. This is a great way of tidying up your dashboards, providing more context in your IoT dashboards.
Find out more about Override in Soracom Lagoon
5/ Playlist – Create Dashboard Slideshows
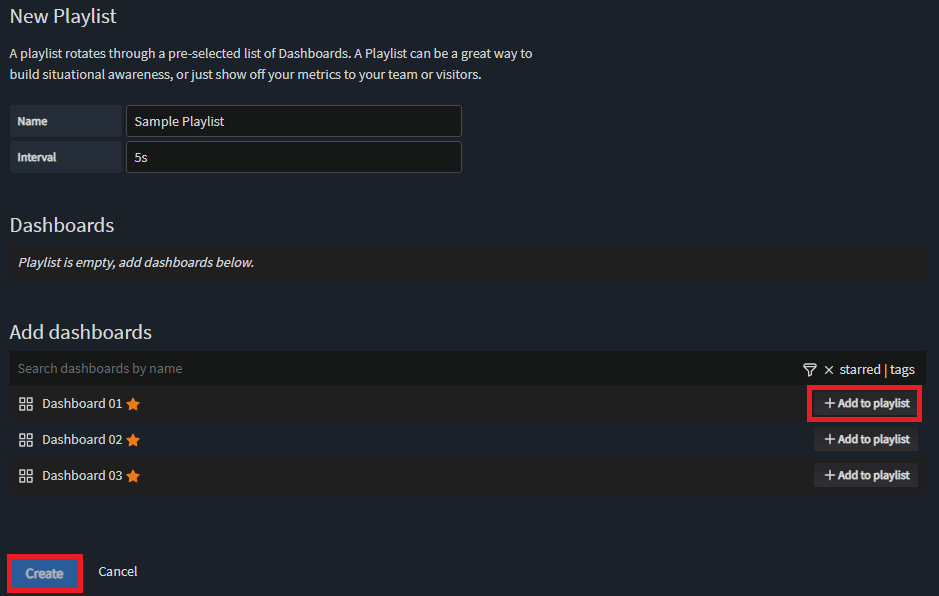
The new Playlist feature is a handy way of displaying multiple dashboards in a simple slideshow format.
This is useful when projecting different graphs and performance stats to a TV or kiosk for example, where you’ll have full control over what data is shown and how quickly to move between slides.
Find out more about Playlist in Soracom Lagoon
6/ Sample Data – Learn How To Use Lagoon
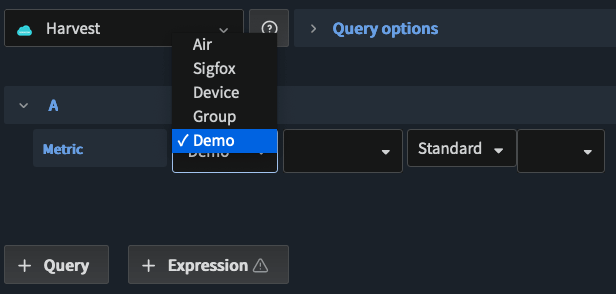
With Sample Data, anyone with a Soracom account can use out-the-box demo data to experiment with a broad range of dashboards in Lagoon, totally free of charge.
This will help anyone who’s interested in getting their hands on this powerful analytics and data visualization tool, but who doesn’t have a device yet, or who hasn’t decided on what format to send data.
You can also use the demo data sources test out the alerts functionality, which will trigger a notification based on a specific action happening inside Soracom.
Find out more about Sample Data in Soracom Lagoon
7/ Transformation – Data Filtering
If you ever see any anomalies in your data, you can use the Transform tool to discard them from your dashboards. For example, if a temperature sensor outputted an abnormally high reading, you could use Transform to remove the spike, tidying up your data visualization.
Find out more about Transformation in Soracom Lagoon
Getting started with Soracom Lagoon
Lagoon was already one of our most powerful features in Soracom, and this updated version provides even more data visualization powers for technology innovators like you.
And the really good news? This latest version is available in the Soracom User Console for all our customers right now.
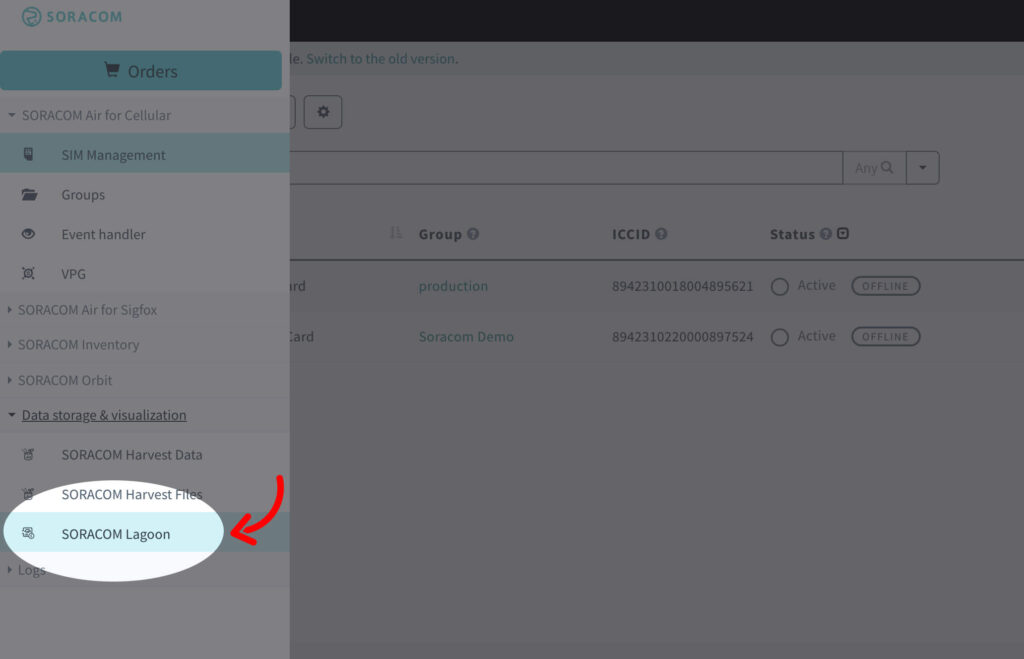
Log in to your Soracom account, click on “MENU” and select “Soracom Lagoon” from the “Data storage and visualization” dropdown.
We hope you enjoy this latest version of Soracom Lagoon! Any questions? Contact us here.


MORE LIKE THIS


What is Soracom?
Discover why technology innovators choose Soracom for connecting their
devices to the cloud over cellular.
Soracom's Picks
Advices and interviews, to inform and inspire.


Retail’s “Invisible” Workforce: How IoT-Enabled Vending and Kiosks Are Rewriting the Rules of the Brick-and-Mortar Experience
TL;DR Walk through a modern shopping mall before the anchor…

Security Shouldn’t Depend on the Device: Introducing Soracom Traffic Filtering
TL:DR There’s a quiet paradox at the heart of IoT…
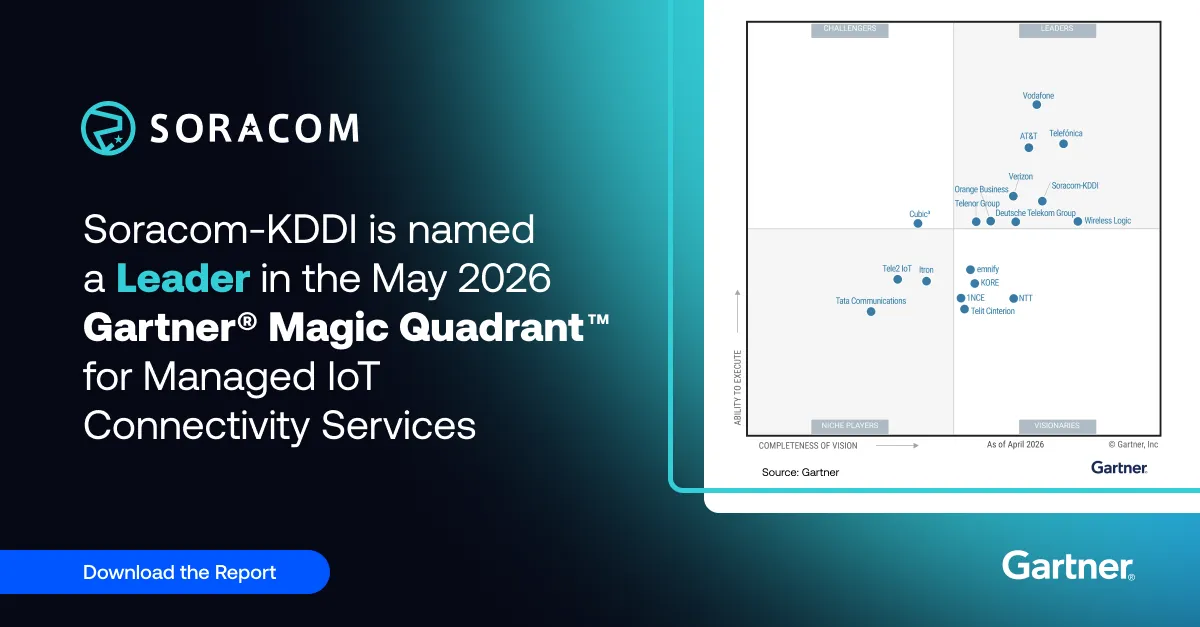
Soracom-KDDI’s Recognition as a Leader in the Gartner® Magic Quadrant™
TL;DR A New High-Water Mark for Soracom This has been…
Cloud Native
IoT Connectivity Platform
Soracom built the worlds first cloud-native connectivity management platform, built on AWS. Learn more about going beyond connectivity.